It is curious fact that the surface waters southeast of Greenland have remained cold in stark contrast to the warming of the rest of the subpolar North Atlantic. Over the years a number of studies have asserted that this cold area (aka warming hole) reflects a slow-down of the Atlantic meridional overturning circulation (AMOC) leading in time – perhaps even rapidly – to a much cooler climate across Europe and Scandinavia. This has always struck me as a fanciful stretch as any major change in European climate must result from a cessation of warm water flow into the Nordic Seas, not to the area south of Greenland. Scandinavia and northern Norway enjoy temperatures vastly warmer than anywhere else around the globe at those latitudes thanks to a branch of the Gulf Stream that flows north into the Nordic Seas between Iceland and Scotland.
So, what causes the warming hole if it isn’t a slow-down of the AMOC? The answer is hiding plain sight, it is freshwater run-off from the Greenland glaciers. Normally run-off water stays close to the coast as it drifts south and around Cape Farewell. But in winter it can get blown away from the coast by the fierce tip jet, an extremely strong wind that can develop around the southern tip of Greenland. Due to earth’s rotation, these surface waters will get deflected away from the coast and join offshore waters that are steered to the south by Eirik Ridge, a major topographic feature that extends south from the island as you can see here:
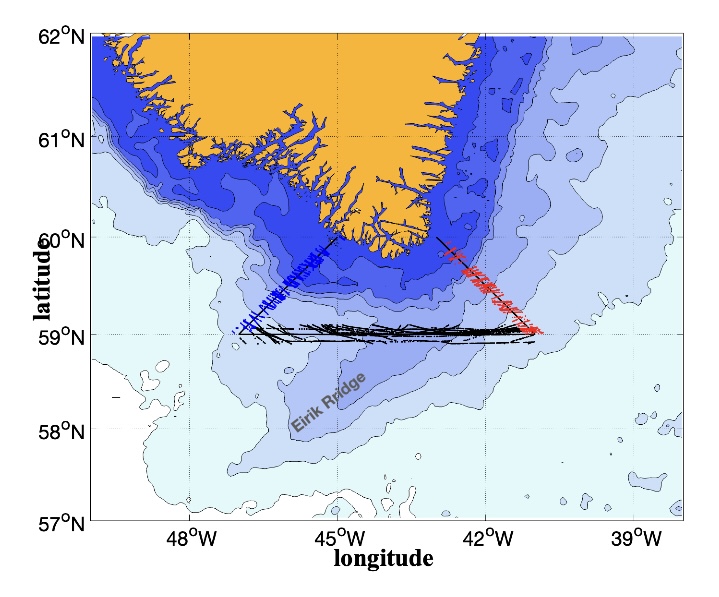
The map also defines three sections where I use ADCP data from the merchant marine container vessel Nuka Arctica during its transits to and from Nuuk. More on this below.
We can make a rough estimate of how large this Ekman transport might be. Let’s assume the stress during a tip jet outbreak is 1 N/m2. Dividing stress by the Coriolis parameter (10e-4) and the density of water we obtain ~10 m2/s. If the stress is acting over a 100 km stretch of coastal water the total transport would be ~10e6 m3/s (or 1 Sverdrup). Finally, over the course of the winter perhaps let’s say we have 10 extreme winds each lasting 24 hours; this gives us 10 days x 86400 sec/day x 100 km x 10 m2/s = ~10e12 m3. This is enough water to fill a 500 km square region to 4 m depth. This is vastly more than we need; the point is there is plenty available run-off water with which to dilute the region south of Greenland. Most of the water will remain in the coastal current and wrap around Cape Farewell to the northwest. While the subpolar North Atlantic is clearly getting warmer, the warming hole is not. There is even a hint that it is getting cooler which could be a consequence of increased ice melt in recent decades.
The following figure shows transports around Cape Farewell.
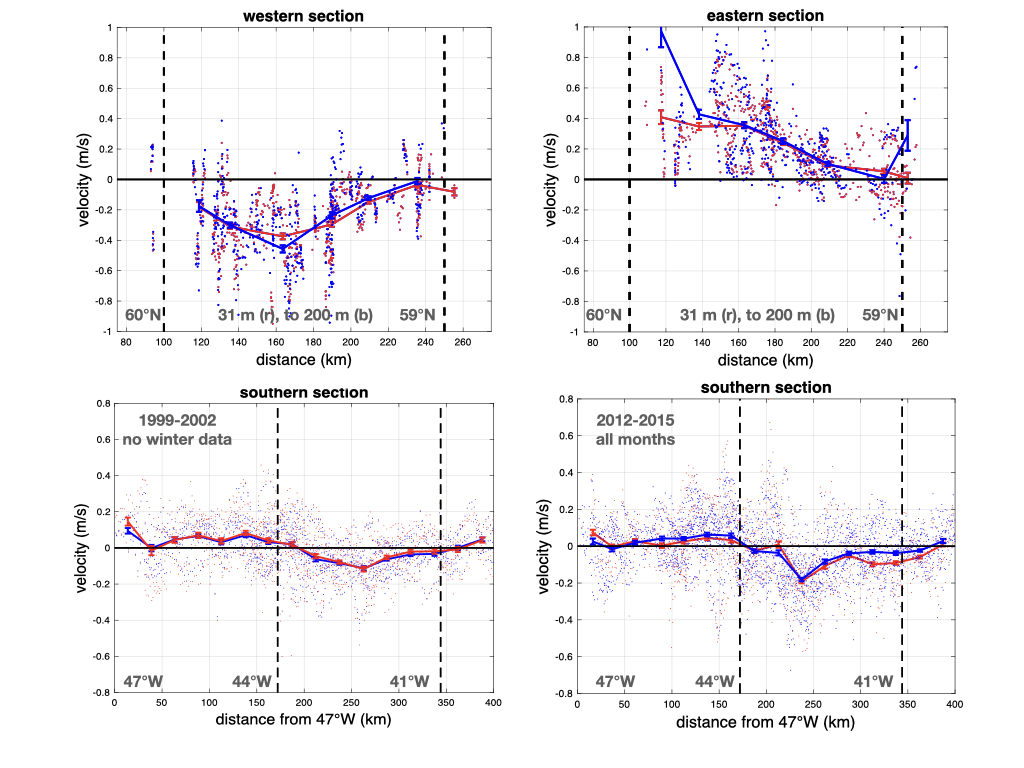
It shows normal velocity at the three sections in the map where I’ve picked out all ADCP velocity profiles when the vessel Nuka Arctica is passing through these areas (the data have been detided). Positive velocity means flow into the triangular domain. In all panels red means velocity at 31 m depth while blue is a vertical average to 200 m. The eastern and western sections show comparable transports but the uncertainties, especially near the coast, are large. The zonal section at 59°N is more telling. The left panel is from the 1999-2002 period (150 kHz ADCP); the right panel from 2012-2015 (75 kHz ADCP). The mean velocity patterns are similar except that ship also operated in winter in the latter period. The red line reveals surface velocities to the south at the eastern end of the line, roughly 300 to 375 km. These wintertime surface velocities are suggestive of an Ekman transport. Ekman layer thickness varies enormously, but supposing the excess velocity (roughly 0.05 m/s) applies to the top 50 m over 50 km the mean transport would O(0.1) Sv. This is not inconsistent with the rough calculation above, and importantly, it could be water that has been blown away from the coastal band. An experimental verification of this might consist of tracking surface drifters deployed near the coast prior to tip jet events.
The evidence for an ongoing slow-down of the AMOC is shaky at best and appears to lean heavily on proxy data. Studies of upper ocean AMOC transport within the Gulf Stream, whether in the Florida St or at the Oleander show no decline in recent decades. Geostrophic estimates of transport at the Oleander line as well at the entrance to the Nordic Seas over the last 50-70-90 years show no significant decline in transport. This is not saying the AMOC might not change in the future, but it hasn’t yet. In fact, given the role of the AMOC to European climate within a warming world there is every reason to give it our full attention. There is so much we still don’t understand about the AMOC, and while I may be wrong, this alternative explanation for the warming hole could be such an example.
I use Matlab in all my work. If you would like to explore the Nuka Arctica data please write to me at trossby@uri.edu.