A major motivation for starting the Oleander project in 1992 was to get a sense of how Gulf Stream (GS) volume and heat transport might vary or change over time. So far as I know this was the first time an acoustic Doppler current profiler (ADCP) had been installed in a merchant marine vessel for the purpose of long-term tracking of oceanic variability. While the ADCP had been around for some time, operating it on a high-speed vessel demanded exact knowledge of speed and heading. With the advent of GPS this became possible. The data returns have been a veritable treasure for many. In another post I’ll list some of these. But here I’ll focus on transport.
From time-to-time we have published updates on GS surface transport, most recently Rossby et al,, 2019. It showed layer transport at 55 m depth between 1993 and 2019. This shallow depth was chosen to maximize data returns since the 150 kHz ADCP had only a 200+ m range, but frequent bubble-entrainment interfered with the acoustics limiting the reach of the ADCP. That figure of 12-month averages stepped every 6 months revealed up to 10% swings in transport but no significant long-term trend. Here we take a different approach thanks to 3 years of superb velocity data from the new Oleander where we have installed the ADCP in such a way as to minimize bubble-interference. What a difference it has made.
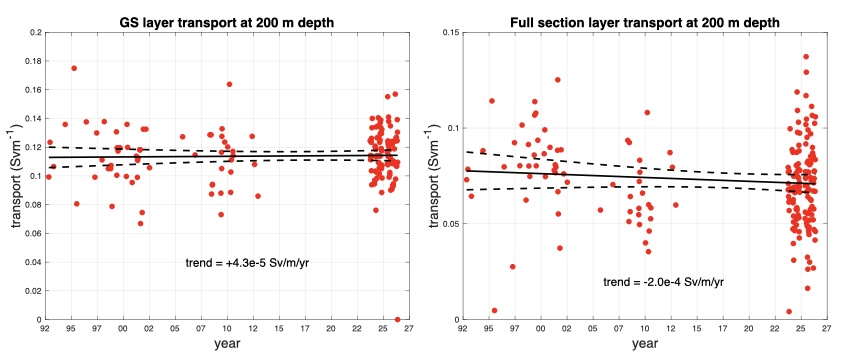
The left panel shows Gulf Stream transport for a 1-meter-thick layer not at 55 m as in the past but at 200 m between Slope and Bermuda (see chart in previous post). This puts us underneath Ekman layer currents which are largely limited to the top 50-100 m depending upon time of year and mixed layer depth. Yet consistent with the earlier studies it shows no significant trend in layer transport since the start of the project in late 1992 over 33 years ago. This is a rather strong statement about the long-term stability of Gulf Stream transport. It is also consistent with an extensive reanalysis of hydrographic data between the mainland and Bermuda (Rossby et al., 2022) using the velocity data from the deep reaching ADCP on the Explorer of the Seas to establish a zero-transport reference layer.
The beauty of measuring GS transport is that it captures all water flowing poleward, water that is being returned as part of the wind-driven Sverdrup Gyre and the Atlantic meridional overturning circulation (AMOC). It is thus a very efficient method for tracking transport compared to measuring return flows at depth since these are not as tightly defined. The right panel shows layer transport for the entire section. It shows that at this depth 0.11 – 0.07 = 0.04 Svm-1 or about 37% is recirculated north and south of the stream. Interestingly, the GS segment exhibits less variance than the full section. This may in part be due to variable presence of warm and cold core rings north and south of the GS. It also shows a suggestive decrease in transport. The reasons for this will have to be looked at more closely, but if real I suspect it reflects a weakening of the westward flow north of the GS. At the Oleander line and elsewhere the GS has shifted north indicating a narrowing of the Slope waters. We also know these waters have been warming over time (Andres et al., 2025).
While the GS captures all water flowing poleward, it doesn’t tell us how much is Gyre and how much is AMOC. In our 2022 paper we used geostrophy to estimate the volume transport between Bermuda and Africa as our measure of the Gyre. A more direct and cost-effective method might be to establish a program to capture all water flowing north in the North Atlantic Current NAC) east of the Grand Banks where it is a narrow stable western boundary current. This can be done quite effectively with ADCP-equipped merchant marine vessels crossing the subpolar North Atlantic. We’ve written about this before. In addition, a few strategically placed moorings with upward looking ADCPs would be helpful to gain a better measure of the NAC’s variability, which I imagine will be rather ‘sluggish’ given that it is primarily buoyancy-controlled.
Andres, M. et al. (2025). Monitoring impacts of the Gulf Stream and its rings on the physics, chemistry, and biology of the Middle Atlantic Bight shelf and slope from the CMV Oleander. Oceanography 38(Supplement 1):54–60. https://doi.org/10.5670/oceanog.2025e108.
Rossby, T., C. Flagg, K. Donohue, S. Fontana, R. Curry, M. Andres, and J. Forsyth, (2019). The Oleander is more than a flower: Twenty-five years of Oceanography aboard a merchant vessel. Oceanography, 32(3), 82-95.
Rossby, T., J. Palter, and K. Donohue (2022). What can hydrography between the New England Slope, Bermuda and Africa tell us about the strength of the AMOC over the last 90 years? Geophys. Res. Lett., 49, e2022GL099173. https://doi.org/10.1029/2022GL099173.