Imagine you are looking at a tank of water on a rotating table. The water is at rest in the tank, meaning it is rotating at the same rate as the table. Now increase the rate of rotation of the table slightly. Relative to the table the water is now moving backwards by the same about since it doesn’t know that the table is spinning faster, it continues to spin as before. We have a similar situation on our rotating planet. While the planet has a 24-hour rotation period, ocean currents respond to the component of rotation in the same direction as gravity. The effect of planetary rotation is therefore strongest at the poles, and absent at the equator; it varies as the sine of latitude. In oceanographic terms this means that if a fluid parcel is displaced poleward where the effect of rotation is stronger, the fluid parcel not knowing this, will begin to rotate clockwise. This is exactly what happened to a cluster of floats in polyMODE.
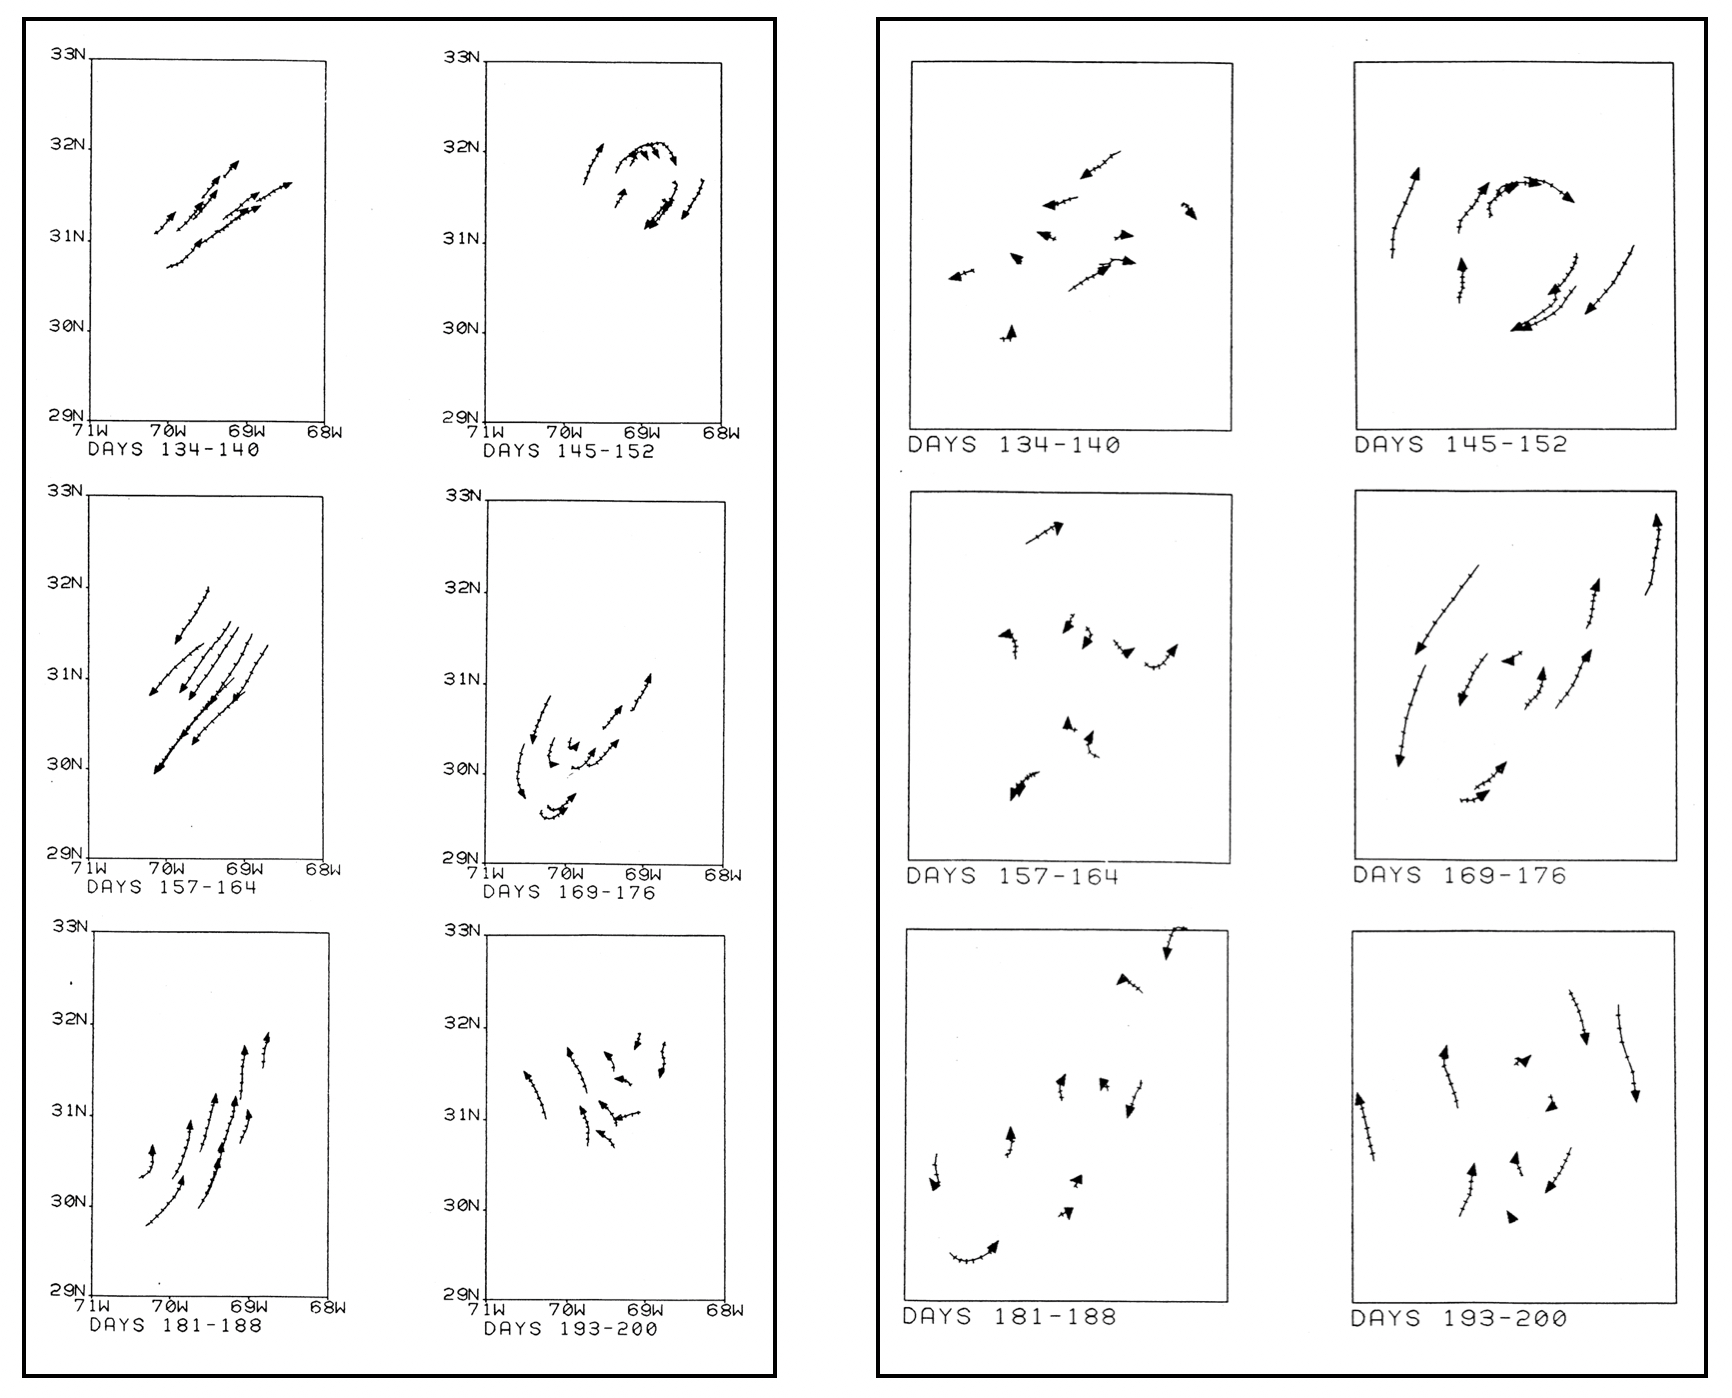
The 1978 polyMODE float program treated us to a lot of new goodies. Besides the lively little spinner described in a recent blog, another first-class treat was the evolution of a cluster of floats at 1300 m depth. At this depth, near the zero crossing of the first baroclinic mode, fluid motion is largely barotropic; acting as if representing the water column as a whole. The evolution of this cluster gave us a superb illustration of the conservation of not just relative vorticity but potential vorticity. At first the cluster moved NE and in so doing it started to rotate in a clockwise direction. But then the cluster changed direction and went SW over ~200 km, and in so doing arrested the clockwise motion and began to rotate in the opposite direction. But then the cluster again reversed direction and drifted back north again, and again the sense of rotation changed back to clockwise! This is just like being on that rotating table and watching the water while gradually increasing its rotation rate slightly, then decreasing, and then faster again.
But the match between cluster rotation and change in latitude, i.e. relative and planetary vorticity, wasn’t perfect. Jim Price, who was conducting this study, noticed that the bathymetry shoaled from west to east such that the cluster drifted into slightly shallower water in NE and vice versa. When he took the depth variations, which in effect amplified the planetary effect slightly, into account he found much better agreement. This is what is known as the conservation of potential vorticity. The period of this NE-SW motion was about 2 months, consistent with what to expect for a barotropic planetary wave. The paper listed below gives a full account of this study.
In oceanography we don’t have the luxury of the laboratory physicist who can design and execute experiments in a controlled fashion; instead, we must work with what observations can tell us. By pure serendipity this study may have been as close to a design experiment as one can imagine, and what a treat it was!
The figure below illustrates the full 60-day cycle of cluster movement in ~12 day steps in geographical coordinates in the left box, and relative to each other in the right box (where the cluster translation has been removed). The left set of panels in each box shows the floats while translating, the right panels when reversing direction. The right box shows clearly their clockwise motion in the NE and anticlockwise motion in the SW. Beautiful!

Price, J.F. and H.T. Rossby. Observations of a barotropic planetary wave in the western North Atlantic. J. Mar. Res., 40 (suppl.), 543-558, 1982.