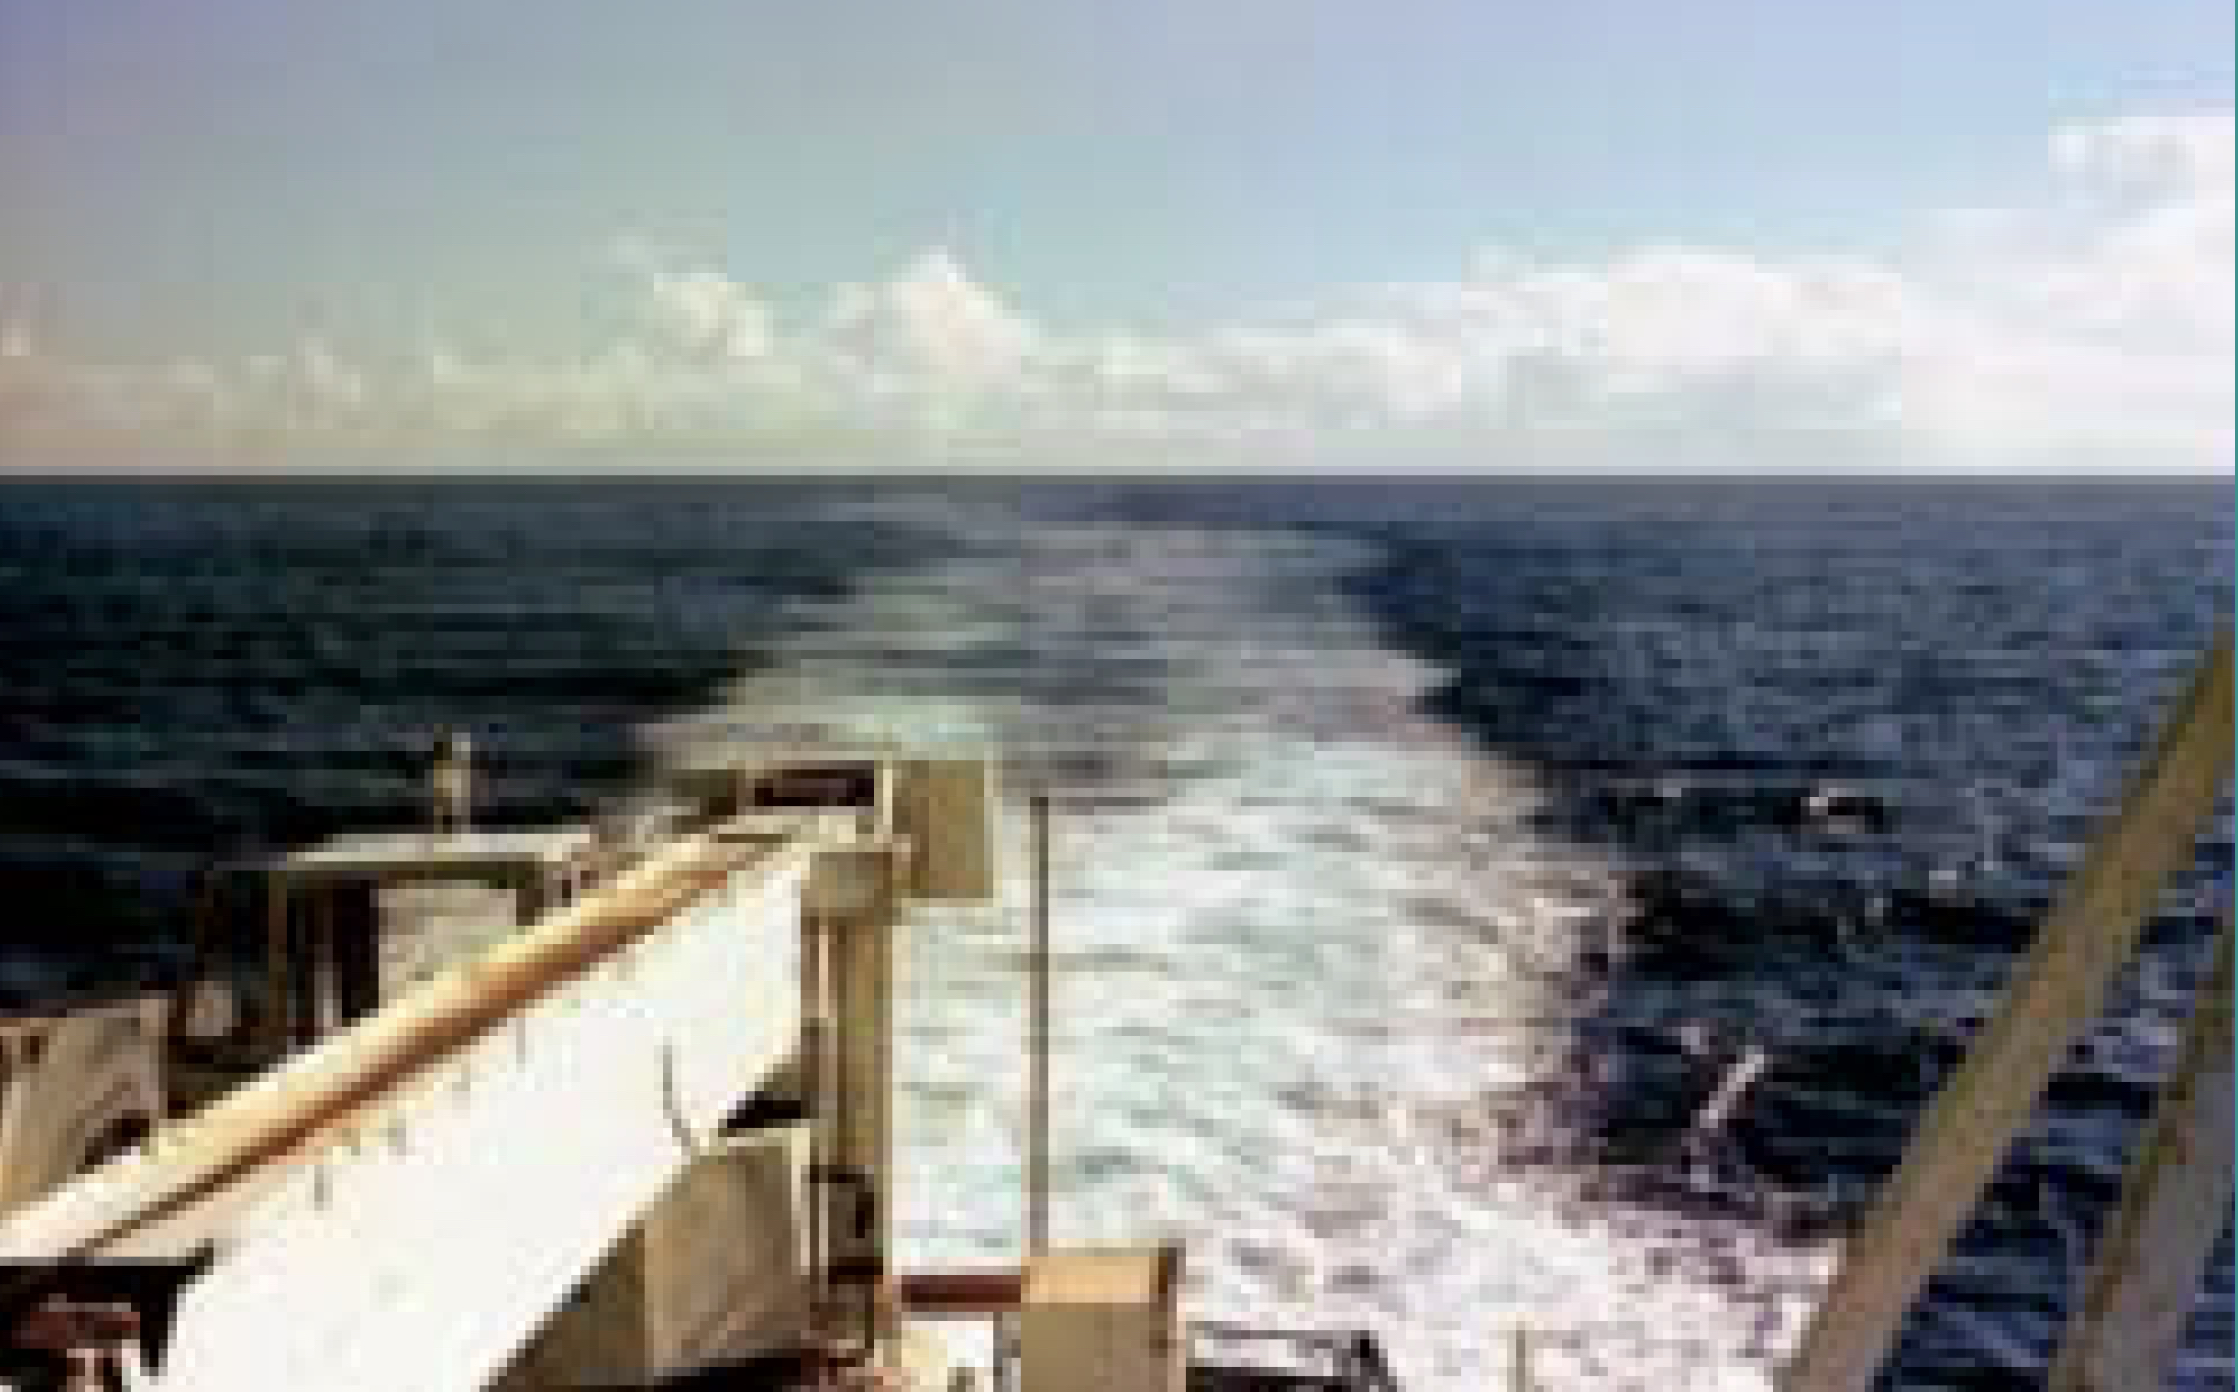
Yesterday Shafer Smith at NYU gave a very interesting lecture about how the new SWOT satellite can resolve submesoscale features in such detail that one can estimate vorticity, strain and divergence – all constructed from the horizontal velocity derivatives ∂u/∂x, ∂u/∂y and ∂v/∂x, ∂v/∂y at O(10) km scales. This is truly amazing. Those of us who have worked in the Gulf Stream know that on occasion the North Wall at the surface has the character of a velocity discontinuity, see photo below with apologies for the poor quality, I can’t find the original. We knew were about the cross the North Wall so I positioned myself about as high as I could on the R/V Knorr so I could get a good view the shearing of the ship’s wake by the surface velocity discontinuity.
There can be little doubt that such a discontinuity requires some measure of convergence. And if so there must be some form of downwelling. We know from our RAFOS float work of considerable vertical movements due to the meandering of the current, but these gave us no insight into the structure of the North Wall below the surface. Past analyses in stream coordinates of the velocity and temperature structure have shown that the transition from the anticyclonic side to the cyclonic side takes place on scales less than 20 km (Rossby and Zhang, 2001). This ensemble average is based on numerous ADCP-scans of the velocity structure from the Oleander’s weekly transects between Bermuda and New Jersey. Curiously, we never attempted to examine individual sections to see how sharp the velocity front remained with increasing distance from the surface.
With the new and very successful ADCP operation on the Oleander we can zoom into smaller scales far better than in the past. With the present 5-minute averaging we get a profile every 2 km. But the individual pings are archived, so it should be possible to examine the velocity structure at even smaller horizontal scales. In a recent post I wrote how we could routinely include the along-track horizontal derivatives. The next step would be to construct figures of normal velocity based, at first on the individual pings, and then on a small subsets of pings to see how much of the North Wall structure emerges. The measurement uncertainty of a single ping is large, which is why we construct the 5-minute averages. But at times the velocity jump at the North Wall is so huge it will likely stand out even with shorter averages. What might we expect? Will the velocity jump across the front be just as sharp at depth, and if so how to what depths? If the convergence is strong enough, might it even be possible to detect the vertical velocity component in the ADCP data?
Rossby, T. and H.M. Zhang, 2001. The near-surface velocity and potential vorticity structure of the Gulf Stream. Journal of Marine Research, 59, 949-975.
