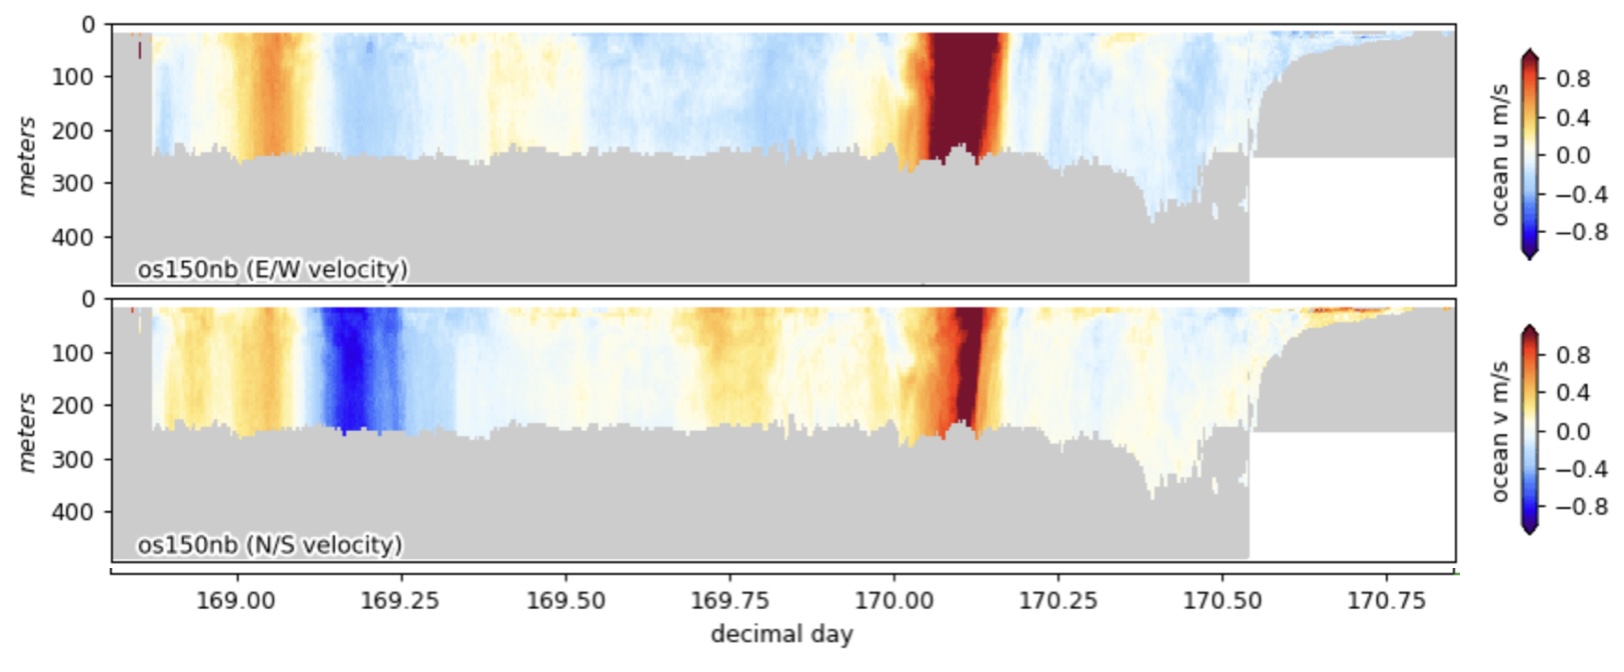
The figure at the bottom of this post shows the EW and NS ADCP velocity along the Oleander path from Bermuda to New Jersey on June 19, 2025. The Gulf Stream shows up clearly as the dark brown band at day 170-170.2. There’s also a very strong southerly flow just north of Bermuda (day 169.2). The Sargasso Sea between these two features seems to be rather quiet on this transect. If you ‘zoom in’ toward the surface, you’ll notice that the velocity field changes character at about 70 m depth. Almost certainly that is the bottom of the mixed layer.
The defining characteristic of the mixed layer is uniformity of temperature. This results from turbulence that can be mechanical due to winds or buoyancy-driven due to heat loss, both of which and especially the latter lead to increased mixed layer depth in the fall months. In spring gentler winds and increasing temperatures restratify the surface waters leading to thinner mixed layers. The thickness of the mixed layer is defined by where the profile of temperature or density suddenly changes due to underlying stratification. Thanks to the extensive XBT and CTD data-sets several atlases of mixed layer depth as a function of season have been published.
The reason I bring this up is that the Oleander shows us the velocity structure of mixed layer and its relationship to the underlying stratified waters. The following web-site shows the ADCP data that have been collected since the present ADCP operation began in October 2023. https://currents.soest.hawaii.edu/oleander/oleander-150-38/figures/os150-os38-unprocessed-full-secions/os150nb/index.html Scroll through these and you’ll see how the mixed layer, characterized by a sudden change in velocity structure, deepens in fall and shoals in spring. When the mixed layer is well-defined with a sharp transition below, it acts like a slab and can readily slide across the waters underneath in response to the winds. See my March 28, 2024 post about the Ekman layer as seen by the Oleander.
How fast a slab moves depends not only on the wind acting on it but also its thickness. The thinner it is the faster it can move. This came to light when it was discovered that surface drifters will exit the Gulf Stream to the south more readily in summer than in winter (McGrath et al., 2009). Even though wind-stress levels are lower in summer, the mixed layer thickness is so much thinner that the slab velocity is greater!
Today the Oleander also records wind, water, and air temperature along its route. These data can be used with bulk formulae to estimate wind-stress and heat flux at the surface. It might be interesting to redo the earlier Ekman layer analysis knowing now the local forcing instead of the reanalysis products which are inevitably smoothed across both space and time. How well do the Oleander weather data agree with the reanalysis products?
In a recent study we found very good agreement between transport as measured by the Oleander (at 55 m depth) and transport estimated from altimetry (Rossby et al. 2025). This also applied to several reanalysis products we looked at. But these products gave widely different results regarding the Ekman layer. I can imagine revisiting the Ekman layer question with the new Oleander ADCP with its far more complete (vertical and horizontal) coverage of currents, concurrent weather data, and altimetry.
McGrath, G, T. Rossby, and J. Merrill, 2010. Drifters in the Gulf Stream. J. Marine Research, 68, 699-721.
Rossby, T., M. Andres, L. Chafik, and K. Donohue, 2025. A comparative study of velocity and transport estimates along the Oleander line between Bermuda and New Jersey. Earth and Space Science, 12, e2024EA004090. https://doi.org/10.1029/2024EA004090