Until the 1970s hydrography – measuring temperature (T) and salinity (S) throughout the world ocean – was the one and only tool oceanographers had to determine ocean circulation. Qualitatively, one could infer pathways of spreading from the distribution of heat and salt, and quantitatively one could use T/S to calculate the pressure field and construct a reasonable picture of the upper ocean circulation relative to an assumed quiet deep ocean. We could not measure directly what the ocean was doing. This all changed rather suddenly with the advent of the Mid-Ocean Dynamics Experiment (MODE) and other similar studies in the 1970s.
MODE was a sea change in Physical Oceanography. Watch the 59-minute ‘The Turbulent Ocean’ film on YouTube about MODE, it’s a classic. Our contribution to MODE was to explore oceanic movements with SOFAR floats that were deployed to drift freely at ~1500 m depth. In an earlier blog ‘Close call in MODE’ I describe the floats and the issues we had with them.
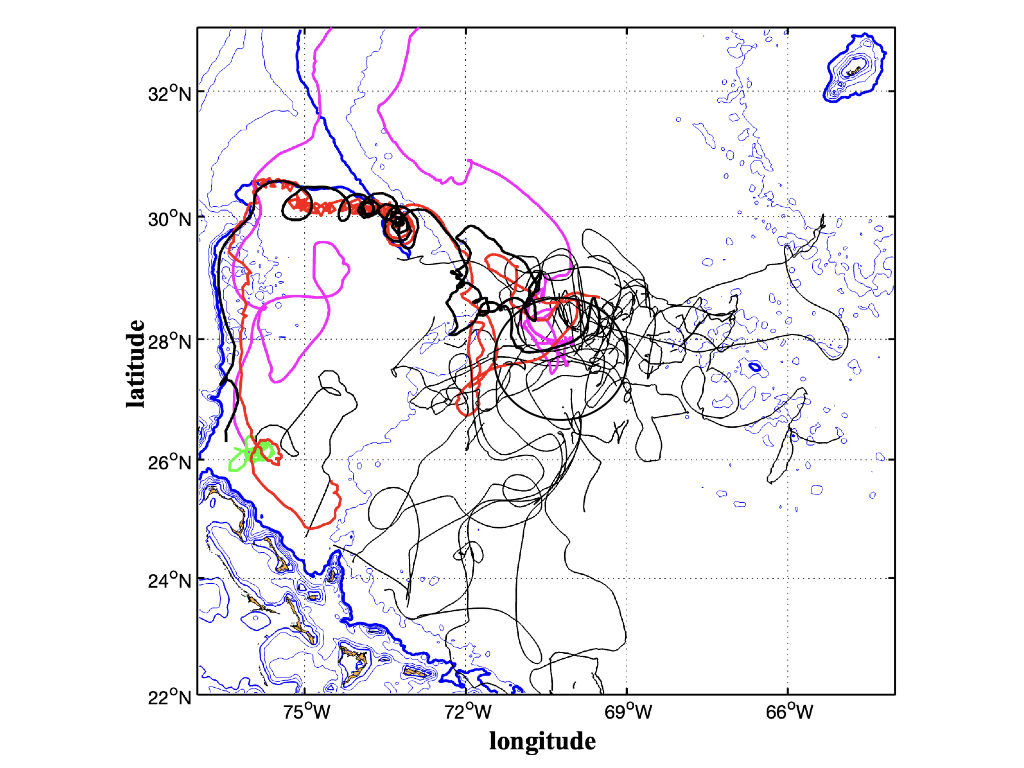
With 20 floats deployed to initially construct stream function maps of the velocity field, we obtained a wealth of information that can be digested in a variety of ways depending upon the questions at hand. Perhaps the most condensed way to show the data is in what we call the ‘Spaghetti plot, a superposition of all trajectories without regard to time. Today spaghetti plots are widely used as an effective way to summarize particle movements in the ocean. View the floats as giant ‘molecules’ (analogous to a geochemical tracer like freon) with the advantage that their movements are time-stamped. The plot below shows all SOFAR float trajectory data from MODE superimposed on bathymetry. The floats were all deployed within a circular region centered at 28°N 69°40’W. From there they spread primarily to the west and notably to the southwest, seven reaching the Caribbean Island arch. Two drift west and get caught up in a lively little cyclonic eddy drifting along the southern slope of the Blake-Bahama Outer Ridge (BBOR) and one to the NW before turning south drifting along the continental margin. The water at this depth comes from the subpolar North Atlantic, principally the Irminger and Labrador Seas, as part of the Atlantic meridional overturning circulation. MODE was too far south for any of the floats to get caught up in the southern recirculation gyre of the Gulf Stream. The two floats that were trapped in the cyclonic eddy did so just east the ridge crest of the BBOR. I would have preferred this to have happened at the ridge crest (4000 m isobath highlighted) or a bit to the west where vortex stretching by the forced flow over the ridge would have spun up the eddy. In any event the orbital period of the red trajectory is about 3.6 days at its fastest. That is surely the fastest spinning eddy or lens we’ve ever seen at these depths. Considering how frequently floats got caught in coherent eddies and lenses in later studies it is a bit curious that only this one and another at 26°N (in green) were observed.

Dow, D. L., H. T. Rossby, and S. R. Signorini (1977). SOFAR floats in MODE. GSO/URI Tech. Report 77-3. 108 pp.