Numerical modelers may have challenges regarding veracity and accuracy of their output, but they have one whopping advantage over us experimental oceanographers - they can make time go in either direction. In a model not only can you determine particle movements going forward, you can also find out where they came from. We can put floats and drifters in the ocean to follow the movement of water parcels, but where that parcel came from we have no idea. If I mark all floats that pass through a certain point, I can see where they came from, but this is a luxury we don’t normally have since advection and mixing cause stuff to spread out and not come together. Here’s an interesting exception.
In the late 1990s several of us joined forces to deploy a large number of isopycnal RAFOS floats in the main thermocline on the 27.5 kgm-3 surface (~7°C). This was part of a major WOCE project called ACCE (Atlantic Climate Change Experiment) including several institutions in US, France and Germany. The Bower et al. (2002) paper gives you an excellent overview of the ACCE float program. The RAFOS float data set is unique in its spatial coverage and temporal span. I suspect there is still a lot of good science hidden in it!
This blogpost is inspired by a recent paper (Fried et al., 2024) who used a numerical model to synthesize float trajectories in the Irminger Current, both where floats went and where they came from. We had a number of 27.5 kgm-3 floats in passing through the Irminger Current so I wondered if the data would allow a similar whence to where analysis. The results are highly suggestive.

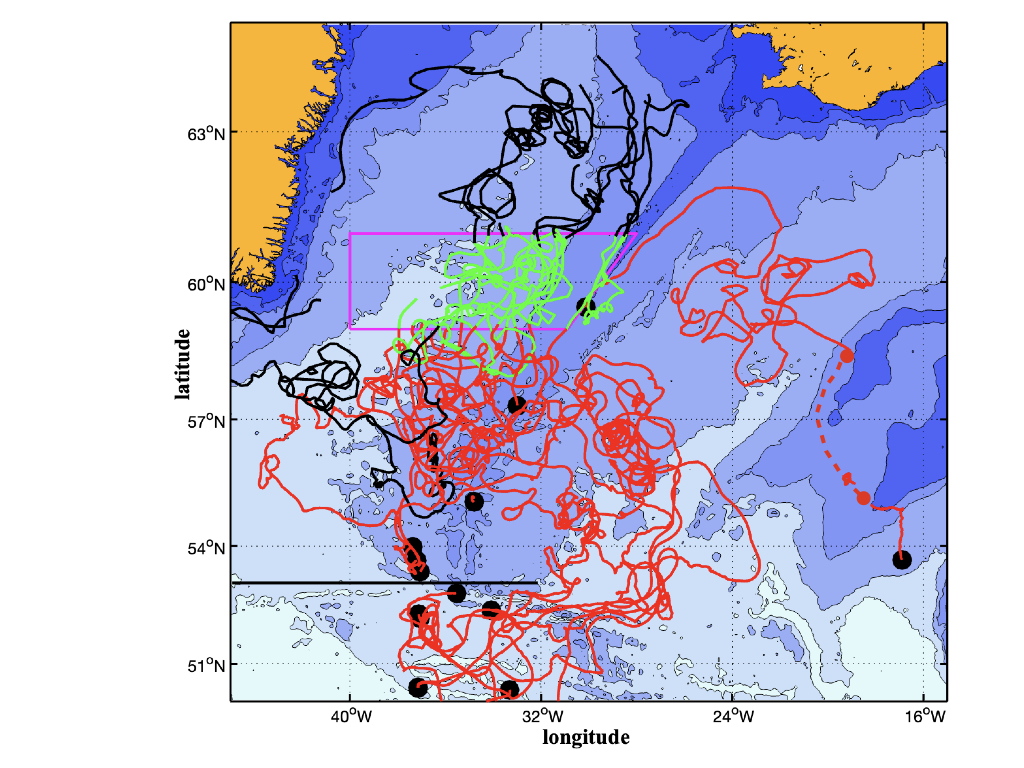
Of the 116 floats that we deployed across the subpolar gyre on the 27.5 kgm-3 surface, 14 entered the magenta box between 59 and 61°N, 40°W and the Reykjanes Ridge in the east. The trajectories are red prior to entering the box, turn green upon entry, and black after their last exit from the box. Ten exited to the north, one each to the east and south and two trajectories ended in the box. The flow north out of the box is evident. One of those floats got caught in the East Greenland Current and disappeared into the Labrador Sea before emerging again in the west (black trajectory at 58°N). We have only one float looping around the Iceland Basin that enters the box, but as you can see, 7 floats enter the Iceland Basin via the Charlie Gibbs Fracture zone in the mid-Atlantic ridge (two floats were deployed south of the figure). They retroflect back west entering the Irminger Current as a broad bundle. Knudsen et al. (2005) showed that at the latitude of the box the Irminger Current has two streams, one just west of the ridge crest and one farther west over deeper water. Of the ten floats exiting to the north, three run close to and largely parallel to the ridge crest. The other 7 exit in two bundles, probably too few to be significant.
Although the number of floats is very limited, the figure suggests that the ridge crest stream is fed more tightly from the Iceland Basin and the western stream more broadly from the North Atlantic Current after retroflection well east of the ridge. The three floats just north of the black line go north because the Reykjanes Ridge blocks eastward motion here. There seems to be quite a bit of eddy activity south of the box, perhaps mixing in water coming from the west as hinted at by the float returning from the Labrador Sea.
The richness of the ACCE float data (Bower et al., 2002) suggests there is more to explored. I find it striking that even this small subset of float trajectories reveals the well-known importance of the Reykjanes Ridge and the Charlie Gibbs Fracture Zone in controlling the major fluid pathways. For other aspects of the ACCE float program see the July 28, 2024, May 2, 2024, December 19, 2023, and August 12, 2023 blogposts.
Bower, A.S., B. Le Cann, T. Rossby, W. Zenk, J. Gould, K. Speer, P. Richardson, M.D. Prater and H.M. Zhang (2002). Directly-measured mid-depth circulation in the northeastern North Atlantic Ocean. Nature, 419, 603-607.
Fried, N., C. A. Katsman, and M. F. de Jong (2024). Where do the two cores of the Irminger current come from? A Lagrangian study using a 1/10° ocean model simulation. J. Geophys. Res.,129, e2023JC020713 https://doi.org/10.1029/2023JC020713
Knutsen, Ø., H. Svendsen, S. Østerhus, T. Rossby and B. Hansen (2005). Direct measurements of the mean flow and eddy kinetic energy structure of the upper ocean circulation in the NE Atlantic. Geophys. Res. Letters, 32. L14604, doi:10.1029/2005GL023615