We all have those moments that remain frozen in our minds, moments that make you stop in your tracks and take notice. Like in earlier notes where I wrote about where angels come from, or the discovery of eddies in the 1539 Carta Marina. Another such ‘wow’ moment occurred shortly after I had returned from a sabbatical leave in spring 1974. I was at WHOI visiting Peter Rhines and his postdoc Howard Freeland when Howard showed me a plot he had just made using the SOFAR float data from MODE, it was a stunner.
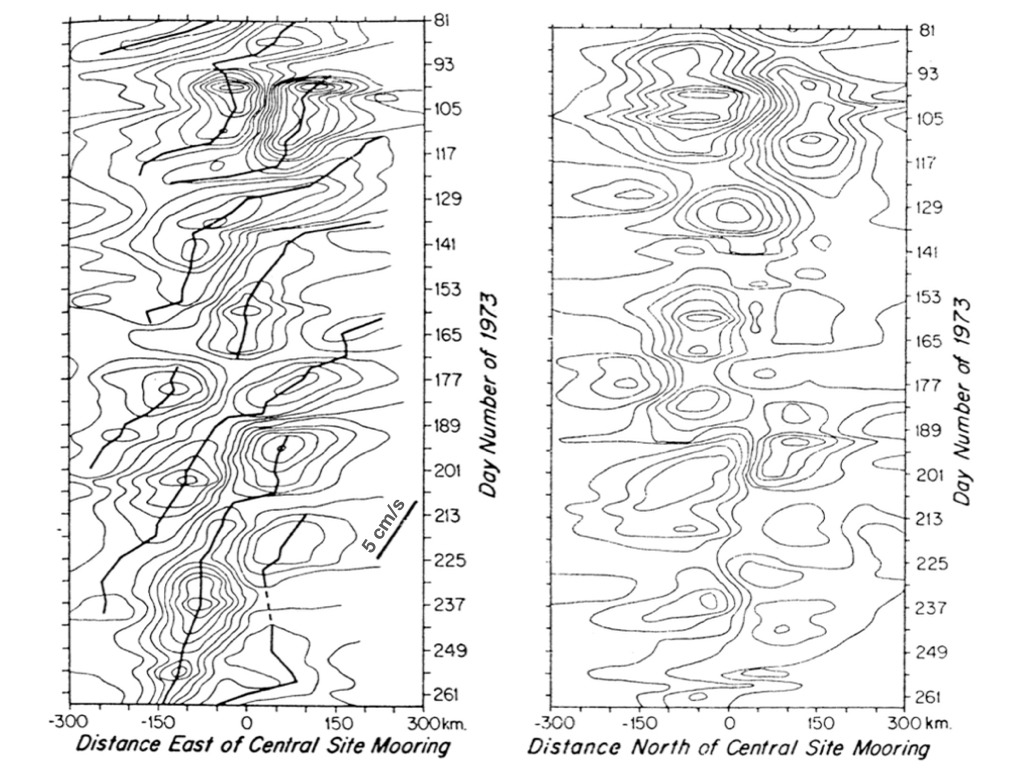
As part of MODE in spring 1973 Doug Webb had deployed 20 SOFAR floats in such a way that we could map out the mesoscale velocity field, the eddy activity if you will. In time the floats would disperse over a larger and larger area (see Spaghetti Plot), but for the first couple of months, they were close enough that Howard could construct a time series of maps of eddy activity in the MODE area. These maps represent the pressure field balancing geostrophic motion at the ~1500 m depth of the floats. To get a handle on how the pressure field evolved over time, he drew a N-S and an E-W line through the center of the maps and plotted pressure vs time for the two lines. He found a distinct westward propagation of the pressure field, but no trend in the north-south direction – strong evidence for planetary wave propagation:

You know the rush you get when you see something unexpected. That’s exactly what happened when he showed me the figure, a stunning display of westward propagation. This may not seem so surprising today, but back then, 50 years ago at the dawn of modern physical oceanography, we were taking first steps with novel instrumentation to explore the ocean in action - we didn’t know what to expect. What a beautiful finding!
Freeland, H.J., P. Rhines and H.T. Rossby. Statistical observations of the trajectories of neutrally buoyant floats in the North Atlantic. J. Mar. Res., 33(3), 383-404, 1975.