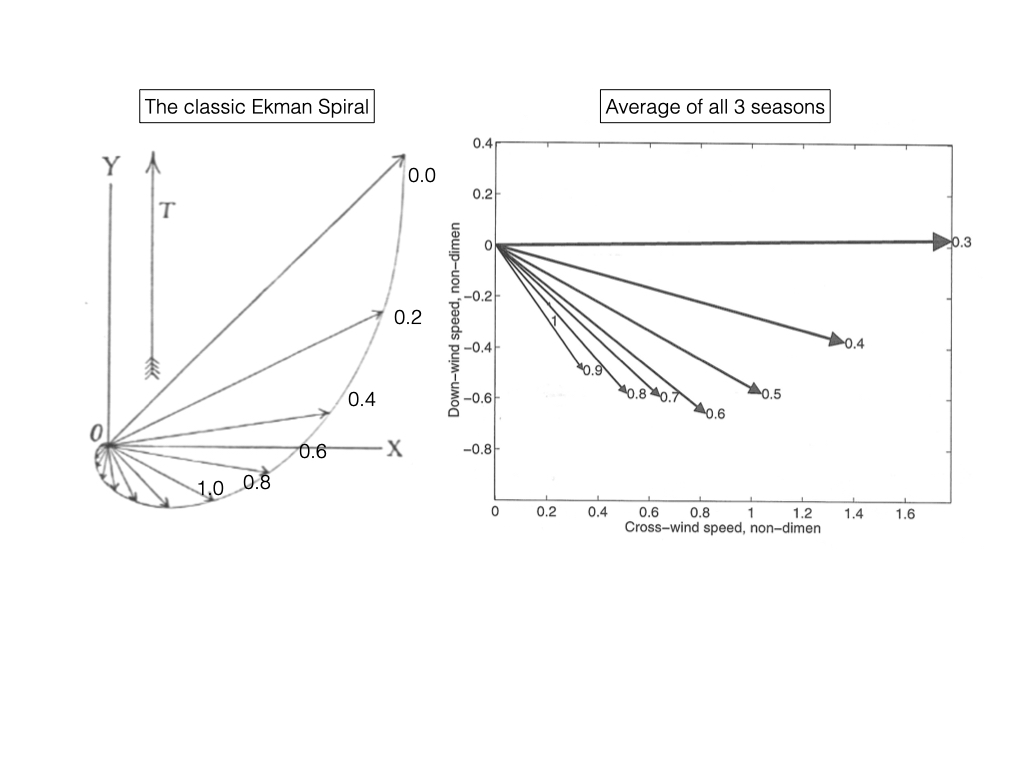
If you search the web for information about the Ekman layer you’ll find plenty of entries. You’ll learn that when the wind acts on the ocean, the surface water doesn’t drift downwind, but at an angle to the right due to planetary rotation. In turn, the surface water rubs on the layer underneath causing it to move to the right of the action on it. And so on to greater and greater depths. The result is a right-turning spiral of decreasing velocity with increasing depth. The vertical sum or integral of these velocities is a transport at right angle to the wind. This wind-driven transport is a well-known phenomenon; it is easily observed and plays a crucial role or link in how the atmosphere drives the oceans. In light of this it is curious that the Ekman layer velocities are so small, measured in cm/s compared to ocean currents which can range up to 2-3 m/s in strong currents such as the Gulf Stream. The winds also kick up surface waves and turbulence so while Ekman transport is evident, we wondered whether the Ekman spiral is detectable, and can it be seen in the shipboard data we had been collecting? Amazingly, the answer is yes.
We had nearly a decade of upper ocean velocity data from the container vessel Oleander along its weekly round trips between Bermuda and the US. The primary objective for collecting these data is to gain a quantitative handle on Gulf Stream transport and its variability. When Scott Stoermer, a graduate student on a fellowship from the US Coast Guard arrived, we discussed whether it might be possible to resolve the Ekman spiral in the velocity data collected from these transits. It proved to be quite a challenge since the velocity structure varies with mixed layer depth, strength of winds, and stratification. One couldn’t just superimpose a set of profiles and expect the Ekman spiral to emerge. We would need to scale individual velocity profiles in both amplitude and vertical scale to bring them into a consistent framework prior to averaging. The strength of the winds, wind stress, determines the strength of the wind-driven transport, so Scott scaled velocity according to wind stress, which he obtained from the National Centers for Environmental Prediction (NCEP). The vertical scale of the Ekman layer depends upon vertical mixing which is in large measure controlled by heat flux at the surface. Heat entering will stratify the waters and make for a very shallow Ekman layer, heat leaving the surface, i.e. cooling, will convectively mix the surface waters and deepen it. A recently developed theory, the Price-Sundermeyer stratified Ekman layer model, proved to be very helpful. It uses both wind stress and heat flux at the surface to estimate the depth over which the wind-generated momentum is trapped. Using their model together with NCEP wind stress and heat flux data he had the tools to scale the upper ocean velocity profile into a non-dimensional framework for ensemble averaging.
To further complicate things, the expected Ekman velocities are only a small fraction of what is observed, the rest being associated with inertial oscillations and the energetic mesoscale velocity field. Since the wind-driven currents decay away from the surface Scott could often isolate these by subtracting the velocity field at a depth just beyond their reach. We didn’t know how to isolate any inertial oscillations in the data, so these were in effect removed through ensemble averaging knowing that their horizontal scale was small compared to that of the Ekman response to the winds. The Ekman layer varied in depth enormously with season. In fact, it was so shallow in summer that it couldn’t be resolved since the velocity profiles started at 20 m depth. The figure shows how his 3-season mean compares with the classic Ekman spiral. The numbers at the arrow tips indicate non-dimensional depth. This was a welcome finding in a nice piece of work; it was a priori not at all certain that we would be able to resolve the spiral structure of the Ekman layer. In short, if you look hard enough, you may find what you are looking for!!!

Stoermer, S. A. (2002). Ekman flow and transports in the northwest Atlantic from acoustic Doppler current profiler data. M.S. Thesis, Graduate School of Oceanography, University of Rhode Island. 93 pp.